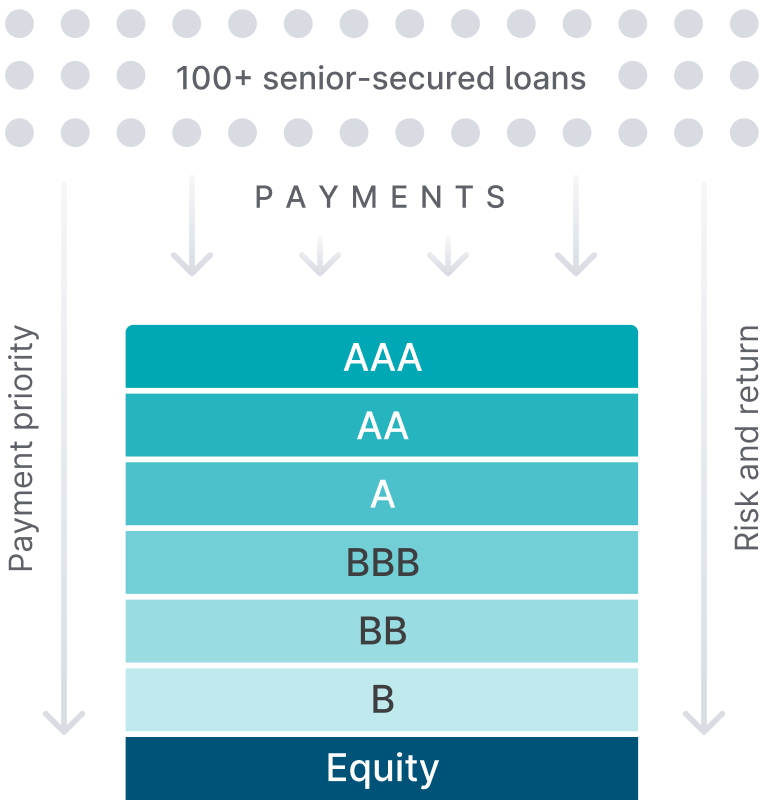
Senior-secured loans pooled into a CLO
Asset managers typically purchase 200+ senior-secured corporate loans to form a CLO.
Investors allocate to tranches
To fund the purchase of the loans, the manager sells stakes in its CLO to debt and equity investors.
The debt portion of the CLO is organized into multiple levels, known as tranches, that investors can select from. A final equity tranche sits at the bottom.
Earn quarterly income
As loans in the CLO distribute principal and interest, cash flows from the top tranche down on a quarterly basis.
Not until all interest owed to the AAA tranche is paid does AA receive payments, and so on.
Delivering competitive historical returns with reduced risk
We believe the BBB and BB tranches of CLOs have the opportunity to deliver some of the most attractive risk-adjusted returns in fixed income.
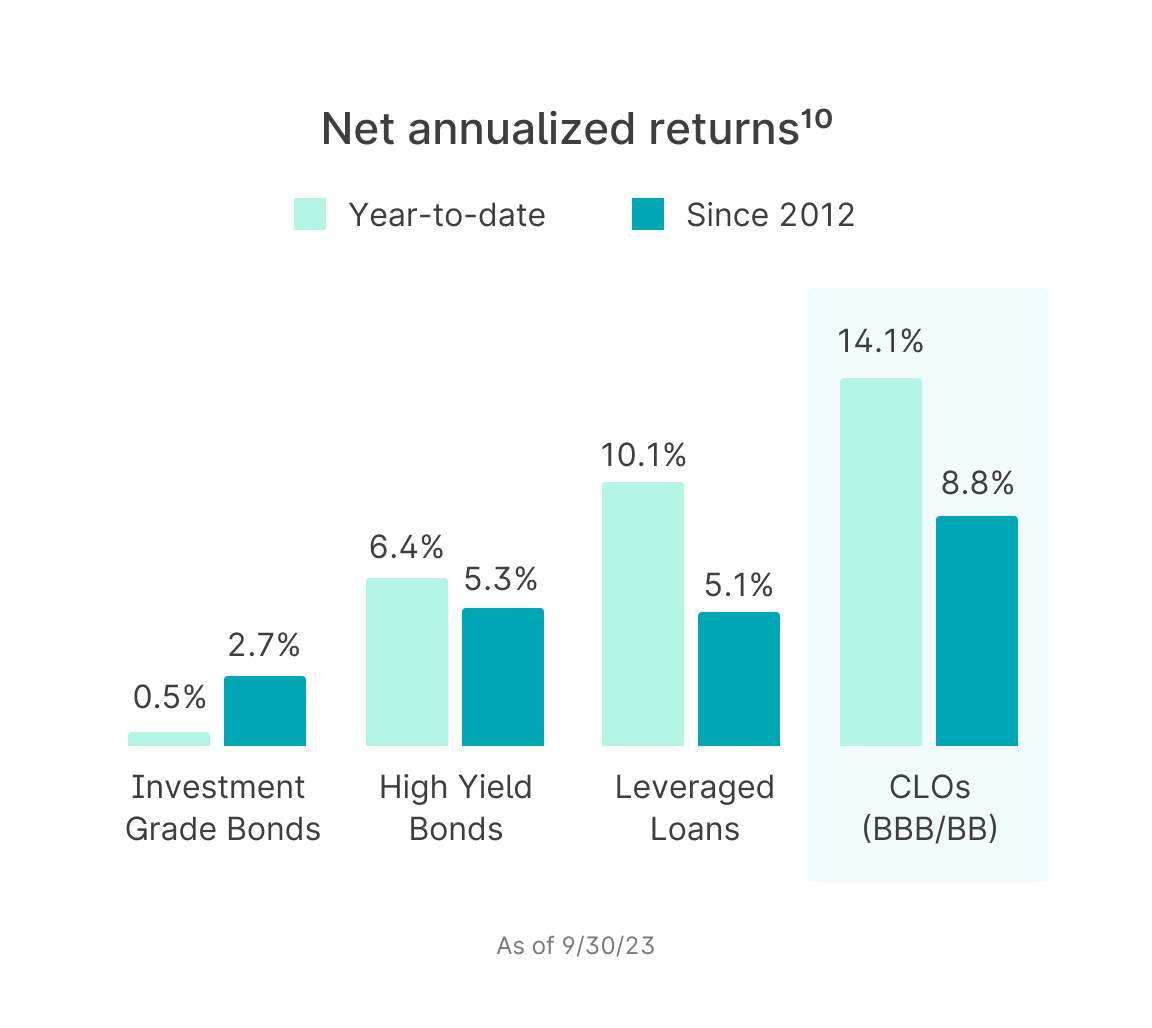
Outperform traditional fixed income
The BBB and BB tranches that our Funds target historically offer higher yields than similarly rated corporate bonds and other structured products.
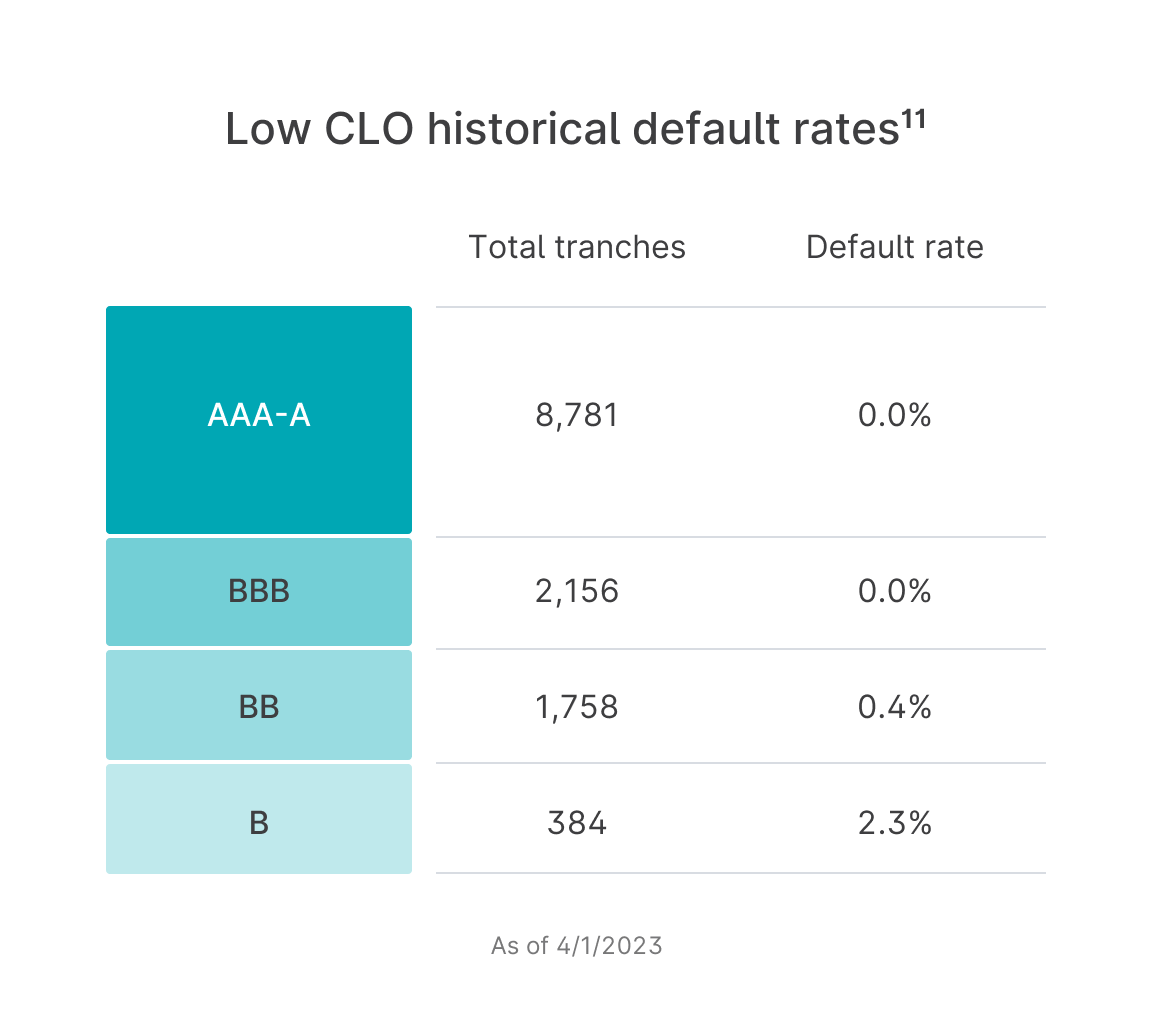
Near-zero default rates
Historically, the CLO structure has proven to be extremely resilient through multiple market cycles.
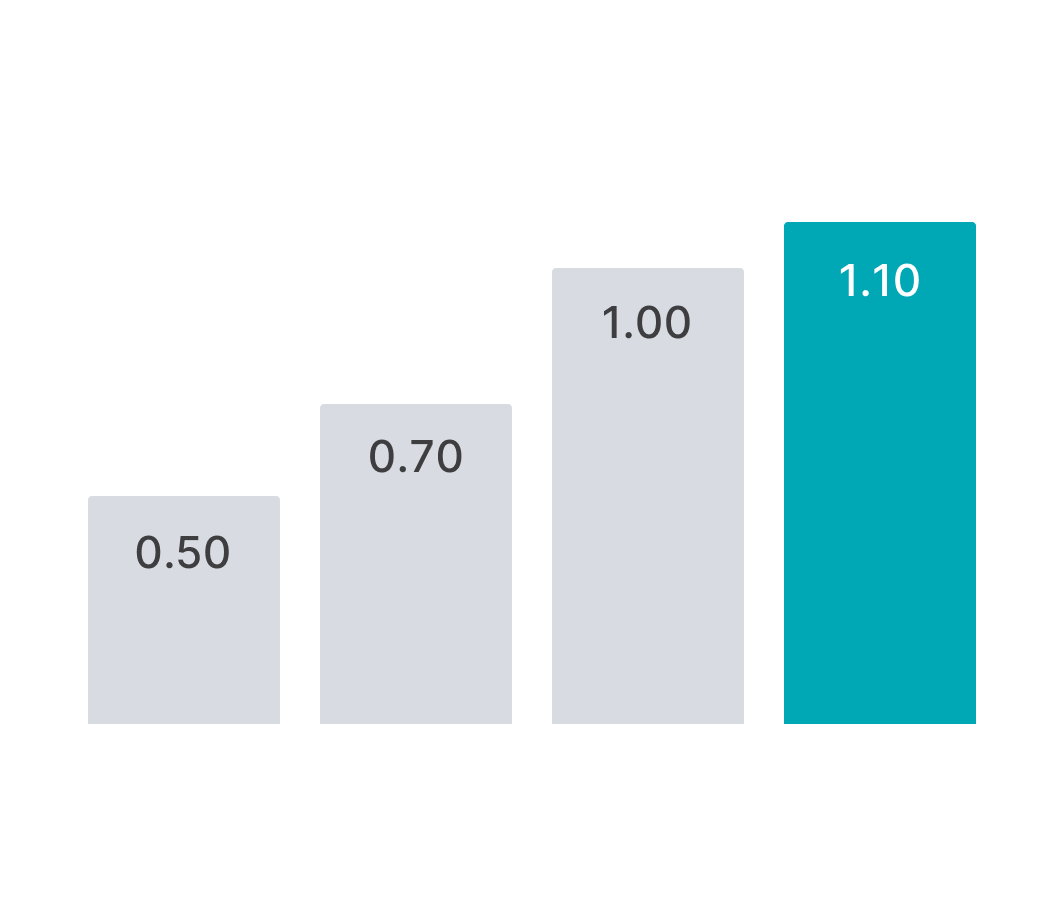
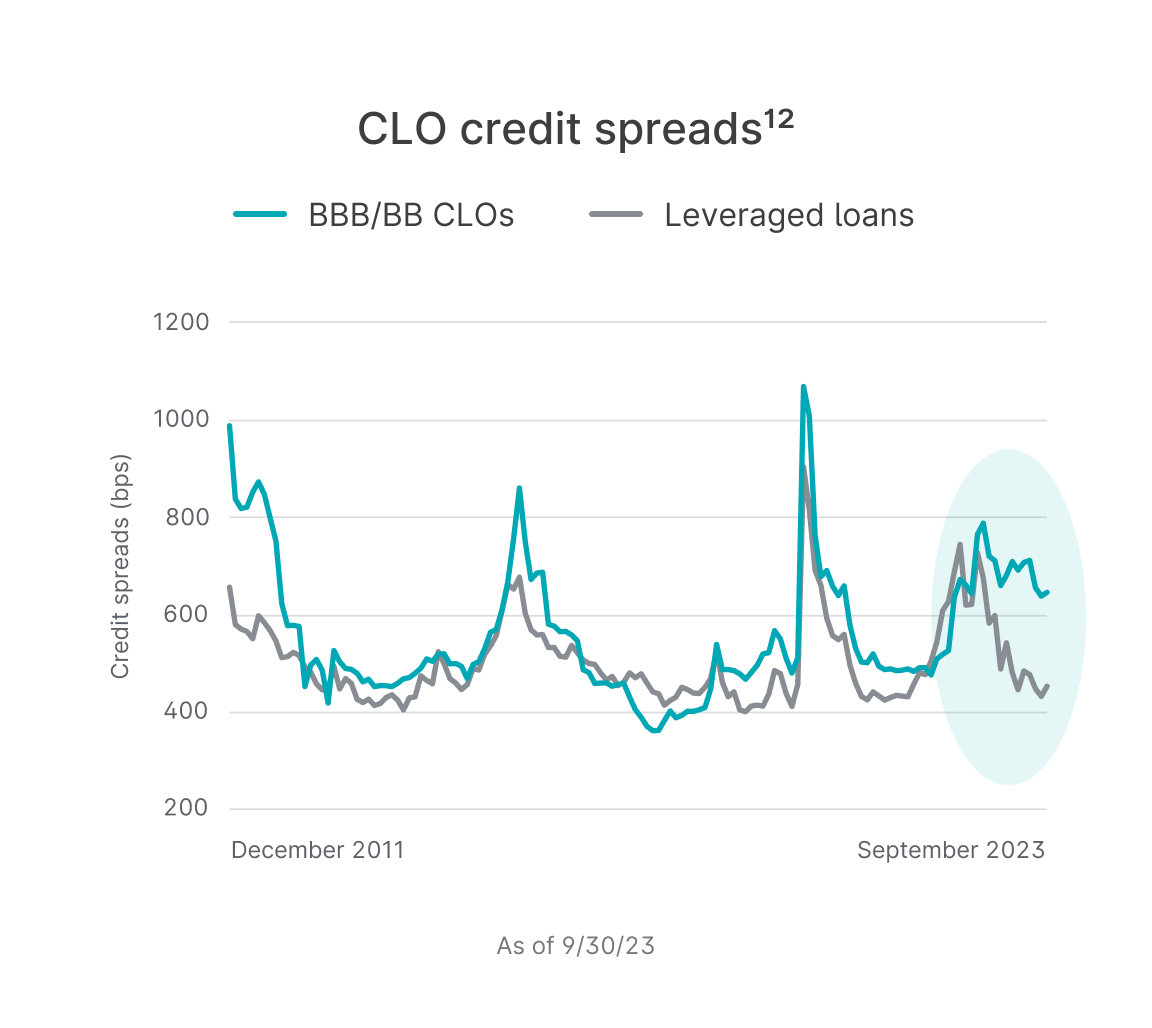
Uniquely wide credit spreads
Wider spreads, a measure of credit risk, allow CLOs to be purchased at a potential discount. As spreads normalize, CLO resale prices are expected to rise.
Access diversified Funds of CLOs
Yieldstreet offers Funds of BBB and BB CLO tranches.
Diversified collateral
Each CLO is collateralized by 200+ senior secured loans issued by companies with typically $100M+ of EBITDA.

Ultra-low default rates
The BBB and BB tranches have average default rates of 0% and 0.4%, respectively.¹¹

Top-tier managers
The Funds will only purchase CLOs structured by prominent asset managers such as Blackstone and Goldman Sachs.

The first private market platform to offer CLOs
We have partnered with Prytania Asset Management as the sub-advisor for our Diversified CLO Funds.
$1T+
CLO market globally¹³$2.2B+
Prytania AUM20 yrs
Prytania years in businessDive deeper
How CLOs work
These slides explore the fundamentals of CLOs and how the unique tranche structure helps protect investors.
View slidesThe opportunity in CLOs with Prytania Asset Management
Mark Hale, CEO and CIO of Prytania, joined Yieldstreet to discuss the benefits of CLOs for investors.
Watch videoCLOs vs. other investment products
See how CLOs compare to various fixed income and structured products.
Explore the differencesPast performance is not indicative of future performance.
9. Source: Yieldstreet, Prytania Asset Management, JPMorgan, as of 9/30/2023. Data is from the period beginning 12/31/2011. CLOs are represented by the JPMorgan CLO Index, Investment Grade by the JPMorgan US Liquid Index, High Yield by the JPMorgan Domestic High Yield Index and Leveraged Loans by the JPMorgan Leveraged Loan Index.
10. Source: Yieldstreet, Prytania, JPMorgan, as of 9/30/2023. CLO BBB/BB is represented by a custom index of 60% JPMorgan CLO BBB Index and 40% JPMorgan CLO BB Index. CLOs are represented by the JPMorgan CLO Index, Investment Grade by the JPMorgan US Liquid Index, High Yield by the JPMorgan Domestic High Yield Index and Leveraged Loans by the JPMorgan Leveraged Loan Index.
11. Source: S&P Global CLO Spotlight: U.S. CLO Tranche Defaults as of 4/1/2023.
12. Source: Yieldstreet, Prytania Asset Management, JPMorgan, as of 9/30/2023. Data is from the period beginning 12/31/2011. CLO BBB/BB is represented by a custom index of 60% JPMorgan CLO BBB Index and 40% JPMorgan CLO BB Index.
13. Source: JPMorgan. As of Nov 2022.
2 Represents an net annualized return, using an internal rate of return (IRR) methodology, with respect to the matured investments shown in your Portfolio experience, utilizing the effective dates and amounts of subscriptions and distributions to and from the investments, net of management fees and all other expenses charged to the investments.[read more]